Reactive approach to address performance issues makes Exchange management more challenging
Not having the ability to see critical health indicators, such as mailbox usage or database I/O, makes troubleshooting difficult.
Various Exchange server roles interacting with one another complicates your ability to find the source of the issue.
Insufficient physical and virtual server resources, including CPU, memory, disk, etc., negatively impact Exchange performance.
Proactive performance monitoring and alerting
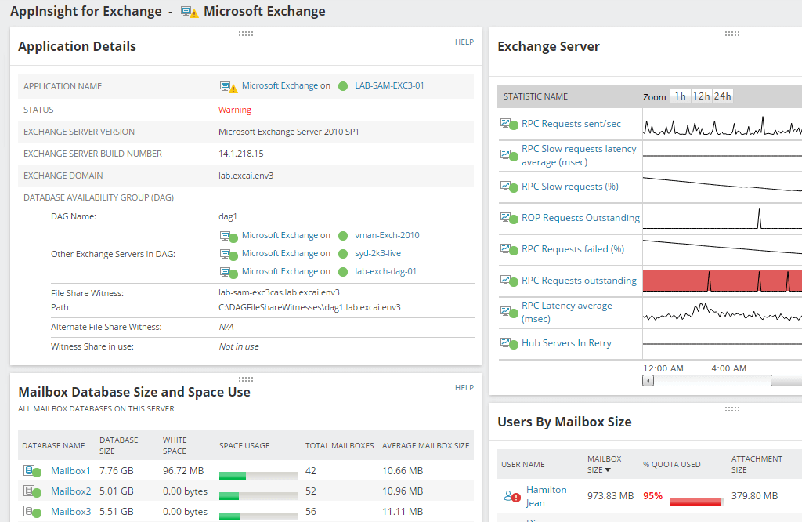
SolarWinds® Server & Application Monitor (SAM) provides quick insight into the health, availability, and performance metrics of your business-critical email infrastructure. The built-in Applnsight™ for Exchange dashboard lets you monitor key performance statistics about mailbox database size and usage, mail queues, message delivery delays, storage issues, events, critical services and processes, and more.
Get alerted when any performance counter reaches warning or critical threshold so you can proactively address the situation before it becomes a problem and impacts end-users.
Monitor various Exchange server roles
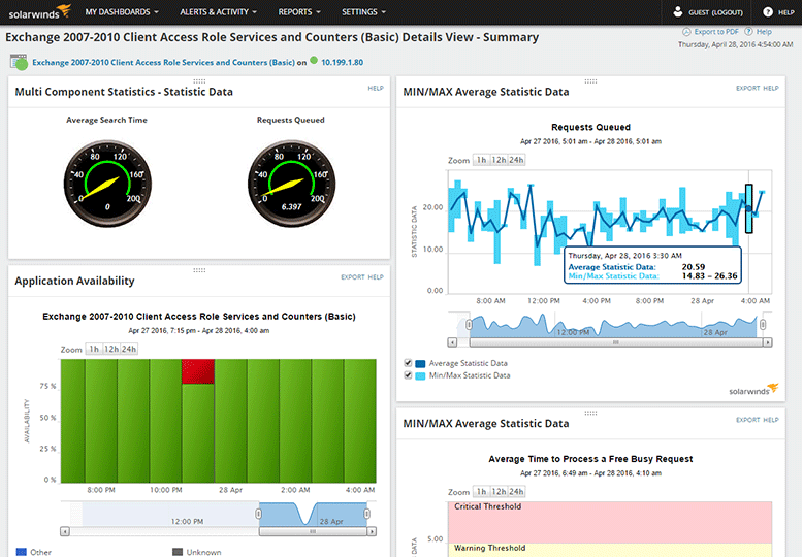
From a single web interface, monitor various Exchange server roles such as mailbox, edge transport, hub transport, and client access server. Get detailed performance metrics for key Exchange components including information store, resource booking, calendar attendant, replication, transport queues, ASP.NET, Active Sync, OWA, web service, RPC client access, UM availability, and more.
Server & Application Monitor provides out-of-the-box templates to monitor Exchange server 2003, 2007, 2010, and 2013. Easily customize these templates to add more components based on your monitoring needs.
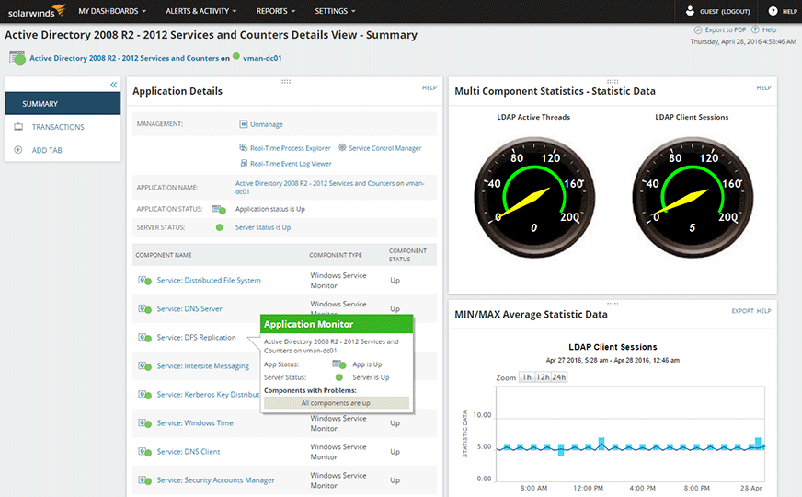
Diagnose issues with database and Active Directory
Exchange issues can also be caused by performance problems in the database and Active Directory (AD). Server & Application Monitor lets you easily identify whether an issue in the Exchange server is due to slow database performance, or AD login failure, etc.
- Monitor key AD metrics including LDAP active threads, bind time, client sessions, DFS replication, DNS server, intersite messaging, and more.
- Monitor a wide range of databases including SQL Server, Oracle, MySQL, IBM DB2, and others.
- SAM supports monitoring over 200 applications out-of-the-box, including IIS, Java, Linux, Ctirix, and more.
Investigate complex Exchange server issues
View your IT environment in a single dashboard to troubleshoot performance issues in Exchange and the supporting physical and virtual infrastructure. Monitor server performance, response time, resource utilization, hardware health, and more.
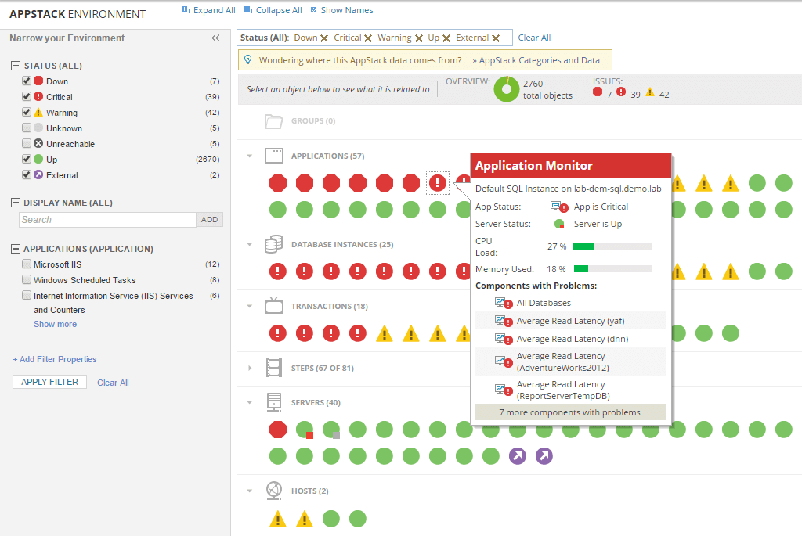
The built-in AppStack™ dashboard in Server & Application Monitor provides immediate line of sight to view the relationship between Exchange and other other applications, and the underlying infrastructure, including servers, volumes, virtual machines, hosts, datastores, storage arrays, LUNs, and more. This allows you to pinpoint the root cause of Exchange issues, which speeds up troubleshooting.
